


Smartyplanet Web Software
The spearhead of Smarty solutions for visualizing, understanding, and controlling data recorded in real time
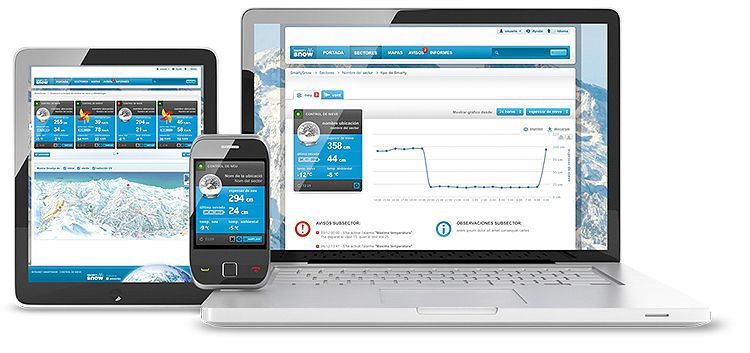
The web application is specifically designed to visualize, manage, and share wireless sensor data in a simple and intuitive way. It features multiple functionalities that provide easy and straightforward navigation without compromising reliability and accuracy. It allows remote access, data visualization, access to map modules, reports, and alerts.
The Web Platform
View and manage the data recorded by the sensors:
The web application is updated periodically to incorporate new technologies that help it function:
Social Media: Share data, announcements, and reports through Facebook and Twitter. Your contacts will be able to stay up-to-date on all changes and news.
Internet of Things: SmartyPlanet is based on IoT (Internet of Things), for this we use Web Services that allow access and exchange of sensor information.
News blog: Discover new prototypes, improvements to our platform, and many other new features that keep SmartyPlanet constantly evolving.
The Map Module
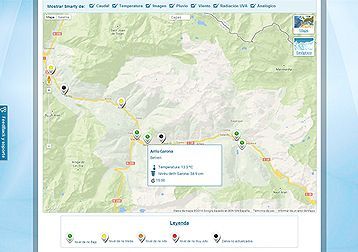
The map module will allow you to quickly view all installed stations, either on Google Maps or on a synoptic diagram.
The sensor thresholds are classified into four states: Low, Medium, High, and Very High. Each state is associated with a color, and the station icon will change color accordingly. This allows you to know the status of each parameter in just a few seconds. An additional state has also been added to indicate that a station is not updating its data.
You can view real-time data from the station's most important sensors, as well as the data update date. Simply hover your cursor over each sensor station marker to do this.
The Reporting Module
Visualize, understand, and act: Detailed reports that reveal the river's pulse!
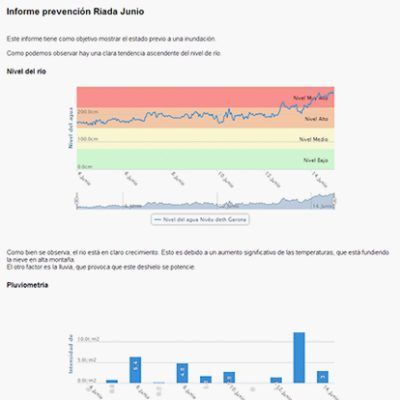
This module allows you to create detailed reports, adding comparative graphs between stations and sensors. You can observe how the river behaves in relation to rainfall or temperature increases. By studying the river's behavior, you can implement preventative measures.
Furthermore, these reports can be edited, customized, and downloaded as PDFs. They can also be configured to be automatically emailed periodically.
The Notices Module
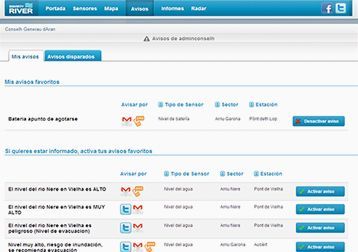
Boost your decisions with our alerts module: the key to transforming your web platform into a Decision Support System. Create, notify, and act! Manage proactively with our pre-configured alerts.
The alerts module is one of the most important; it's what transforms the web platform into a Decision Support System. This module allows you to create new alerts that will notify you via email, Twitter, or SMS of the values set for each sensor.
Preventive actions can be taken thanks to pre-configured alerts.
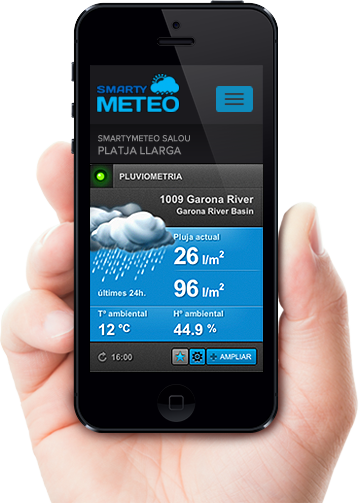
The data can be accessed from any device with an internet connection.
To view the recorded data, we access the Smartyplanet web application. There, we can view the values recorded by Smartys in a very visual way.
